Inscrivez-vous au PU Xtrader Challenge dès aujourd’hui
Échangez avec du capital simulé et gagnez de vrais profits après avoir réussi notre évaluation de trader.
Inscrivez-vous au PU Xtrader Challenge dès aujourd’hui
Échangez avec du capital simulé et gagnez de vrais profits après avoir réussi notre évaluation de trader.
13 April 2023,05:57
Daily Market Analysis
US Treasury yields and the Greenback dipped as investors recalibrated their expectations for rate hikes following the release of March’s Consumer Price Index (CPI), which came in below the market consensus. This unexpected dip in inflation triggered a surge in the prices of non-yielding assets such as gold and crude oil, as the weakening of the US Dollar made them relatively cheaper for investors. The Canadian Dollar surged following the Bank of Canada’s monetary decision to hold its benchmark interest rate steady at 4.50%, a move widely expected by the market. The Bank of Canada also vowed to continue its policy of quantitative tightening, further reinforcing the Canadian Dollar’s strength in the global markets. Finally, the Australian Dollar also experienced a surge in response to the release of upbeat employment data, which underscored the continued strength of the Australian economy.
Current rate hike bets on 3rd May Fed interest rate decision:
Source: CME Fedwatch Tool
0 bps (33%) VS 25 bps (67%)


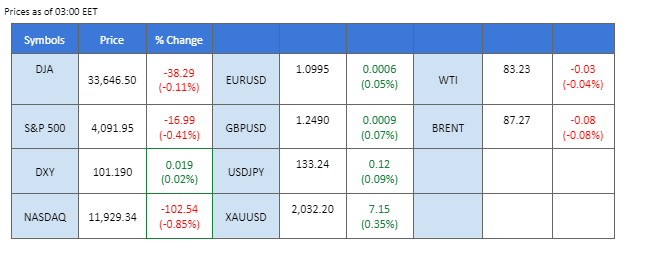
The US Dollar took a severe hit in the wake of underwhelming inflation data coming out of the US economy. The latest reading of the key measure of US inflation, the Consumer Price Index (CPI) YoY, showed a significant decrease from the previous reading of 6.0% to 5.0%, much lower than the market consensus of 5.20%. Meanwhile, the core CPI, which removes volatile items such as food and energy, exhibited a slight uptick to 5.6% from 5.5% yearly. This development significantly raises the likelihood of the Federal Reserve putting a hold on its rate hike decisions.
The Dollar Index is trading lower while currently testing the support level. MACD has illustrated increasing bearish momentum, while RSI is at 33, suggesting the index might extend its losses after breakout since the RSI stays below the midline.
Resistance level: 102.70, 103.40
Support level: 101.45, 100.85
Gold prices are on an upward trajectory, as investors anticipate the Federal Reserve’s potential easing of their aggressive monetary approach to address inflation concerns. This sentiment has been further bolstered by the continued decline of the US Dollar, alongside US Treasuries yields, prompting a surge in demand for safe-haven assets such as gold. The latest reading of the Consumer Price Index (CPI) YoY indicated a noteworthy decrease from the previous reading of 6.0% to 5.0%, significantly below the market consensus of 5.20%.
Gold prices are trading higher while currently near the resistance level. MACD has illustrated increasing bullish momentum, while RSI is at 60, suggesting the commodity might extend its gains after breakout since the RSI stays above the midline.
Resistance level: 2030.00, 2060.00
Support level: 1990.00, 1950.00
The euro slightly rose by 0.65% to $1.0988 against the U.S. dollar after hitting a two-month high of $1.1005 earlier in the session. It comes as the dollar is on the back foot following the release of cooler-than-anticipated U.S. inflation data, which has helped to lift risk sentiment and fuel expectations that the Federal Reserve will conclude its monetary tightening policy after one final hike next month. The EUR/USD pair remains bullish and moves toward the psychological resistance level of 1.1000. Investors are advised to exercise caution and stay vigilant while navigating these dynamic market conditions.
As for now, it continues to hover near the psychological resistance level of 1.1000, despite its inability to break through thus far. A successful break could indicate a further upward trend for the pair. MACD has illustrated a bullish momentum that continues. RSI is at 65, suggesting a bullish momentum as well.
Resistance level: 1.1034, 1.1138
Support level: 1.0965, 1.0917
Bitcoin dropped slightly but remained above $30,000 after hitting its highest level since June on Tuesday. Investors were prepared for potential price swings in the crypto market due to the recent upgrade. However, digital-asset markets have remained largely steady. It is worth noting that the world’s largest cryptocurrency has increased by more than 80% since the beginning of the year, indicating a strong bullish momentum for the cryptocurrency market. Investors and traders will likely closely monitor these recent global currency and crypto market developments as they make informed decisions and assess the potential risks and opportunities in the markets.
MACD has illustrated a bullish momentum that continues. RSI is at 69, suggesting a bullish momentum as well.
Resistance level: 32297, 37553
Support level: 28735, 25069
AUD/USD rebounded following the release of bullish economic data from Australia, which has ignited market optimism about the country’s economic progress. The latest figures from the Australian Bureau of Statistics revealed an Employment Change of 53.0K, surpassing market expectations of 20K. On the other hand, the US Dollar weakened after March consumer inflation figures, boosting further bullish momentum for AUD/USD.
AUD/USD is trading higher while currently testing the resistance level. However, MACD has illustrated diminishing bullish momentum, while RSI is at 66, suggesting the pair might enter overbought territory.
Resistance level: 0.6720, 0.6780
Support level: 0.6640, 0.6580
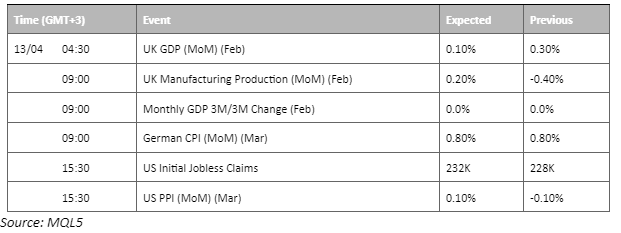
The pound has experienced a significant increase, reaching $1.2495 against the dollar, almost breaking the previous high of $1.2525of following the release of cooling CPI data. The release of the CPI data, which showed a decrease in inflationary pressures, has positively impacted the pound’s value. In addition, the release of the GDP and manufacturing production data will be closely scrutinized by investors and analysts as they seek to understand the state of the UK economy better. While the pound’s recent increase is certainly a positive sign for the UK economy, whether this trend will continue in the coming days and weeks remains to be seen.
MACD rebounded on the zero line, indicating a bullish momentum continues. RSI is at 63, suggesting a bullish momentum as well. As always, investors are advised to exercise caution and closely monitor market developments to make the most informed decisions possible.
Resistance level: 1.2613, 1.2740
Support level: 1.2425, 1.2298
US equity markets encountered a mild setback on Wednesday, despite US Treasury yields dipping following underwhelming inflation data that toned down expectations of an aggressive rate hike stance from the Federal Reserve. The Dow Jones Industrial Average, after four consecutive days of gains, experienced a slight decline of 0.11%, closing at 33,646.50. Despite the release of cooler-than-expected inflation data, concerns over an impending recession continue to linger and dampen the sentiment on Wall Street. Consequently, riskier assets such as equities faced a sell-off, while a shift in sentiment toward safe-haven assets persisted.
The Dow is trading slightly lower following the prior retracement from the resistance level. MACD has illustrated diminishing bullish momentum, while RSI isa t 64, suggesting the index might enter overbought territory.
Resistance level: 34310.00, 35770.00
Support level: 32875.00, 31600.00
Oil prices rose above $83 per barrel, driven by cooling inflation data. The latest U.S. Consumer Price Index (CPI) reading showed a decrease in inflation from 6.0% to 5.0%, lower than the market’s consensus of 5.2%. The core CPI, which excludes volatile items like food and energy, was in line with market expectations of 5.6% yearly. It has led to a drop in the value of the U.S. dollar and increased speculation that the Federal Reserve may halt its ongoing rate hike campaign, prompting oil prices to go up. Furthermore, market sentiment was buoyed by the decline in the U.S. inflation rate, easing the impact of a build in crude oil inventory. In addition, Investors await updates on oil supply and demand as OPEC and the IEA release their monthly reports later this week.
Oil prices edged higher to $83.11 per barrel as of writing. MACD has illustrated neutral-bullish momentum ahead. RSI is at 76, indicating the pair has reached its overbought zone, it might have a technical retrace soon.
Resistance level: 85.45, 90.04
Support level: 81.06, 77.25

Trade forex, indices, cryptocurrencies, and more at industry-low spreads and lightning-fast execution.

8 August 2023, 06:21 U.S. Equity Market Closes Higher Ahead of CPI

7 August 2023, 06:10 Dollar Softer After NFP Comes Short

4 August 2023, 06:20 BoE Delivers 25 BPS Rate Hikes Softening Pound Sterling

Nouvelles inscriptions indisponibles
Nous n'acceptons pas de nouvelles inscriptions pour le moment.
Bien que les nouvelles inscriptions ne soient pas disponibles, les utilisateurs existants peuvent continuer leurs défis et activités de trading comme d'habitude.