Inscrivez-vous au PU Xtrader Challenge dès aujourd’hui
Échangez avec du capital simulé et gagnez de vrais profits après avoir réussi notre évaluation de trader.
Inscrivez-vous au PU Xtrader Challenge dès aujourd’hui
Échangez avec du capital simulé et gagnez de vrais profits après avoir réussi notre évaluation de trader.
2 May 2023,05:47
Daily Market Analysis
The U.S. financial markets experienced much-needed stabilisation after JP Morgan’s acquisition of First Republic bank, the latest financial institution to fail. This development has lifted the U.S. equities markets, with Asian markets also opening higher after returning from the labour day holiday. The dollar index and treasury yields have remained flat, ahead of the Federal Reserve’s interest rate decision announcement scheduled for 3rd May. Investors are keeping a close eye on any potential hawkish surprises, with a 25 bps rate hike widely anticipated by the market. Meanwhile, oil prices are struggling, particularly after China’s Manufacturing PMI index proved disappointing, indicating lower economic activity than the market had predicted.
Current rate hike bets on 3rd May Fed interest rate decision:
Source: CME Fedwatch Tool
0 bps (14.8%) VS 25 bps (85.2%)


The US Dollar has surged to a nearly two-week high against a basket of six major currencies, buoyed by expectations of an imminent 25 basis points interest rate hike by the Federal Reserve. Furthermore, data released by the Institute for Supply Management reveals that US manufacturing rebounded from a three-year low in April, with the US ISM Manufacturing Purchasing Managers Index (PMI) rising from a previous reading of 46.3 to 47.1, surpassing market expectations of 46.8.
The Dollar Index is trading higher while currently testing the resistance level. MACD has illustrated increasing bullish momentum, while RSI is at 59, suggesting the index might extend its gains after it successfully breakout above the resistance level.
Resistance level: 102.15, 103.00
Support level: 101.45, 100.80

Gold prices are struggling to break out above the crucial psychological level of $2,000 due to the recent appreciation of the US Dollar. The dollar has reached a two-week high, buoyed by anticipation of an imminent 25 basis points interest rate hike by the Federal Reserve. Adding to the dollar’s strength, the latest data from the Institute for Supply Management indicates that US manufacturing rebounded in April, with the ISM Manufacturing Purchasing Managers Index rising to 47.1, surpassing market expectations of 46.8.
Gold prices are trading lower following the prior retracement from the resistance level. MACD has illustrated increasing bearish momentum, while RSI is at 47, suggesting the commodity might extend its losses since the RSI stays below the midline.
Resistance level: 2000.00, 2025.00
Support level: 1975.00, 1945.00

The Euro is trading flat but in positive territory ahead of the European Central Bank’s monetary policy meeting. Market expectations are high expecting a 25-basis points rate hike, but the persistent inflationary pressures in the eurozone have raised concerns among investors. The ECB policymakers’ statement will be closely watched by market participants to determine the outlook for future rate hikes.
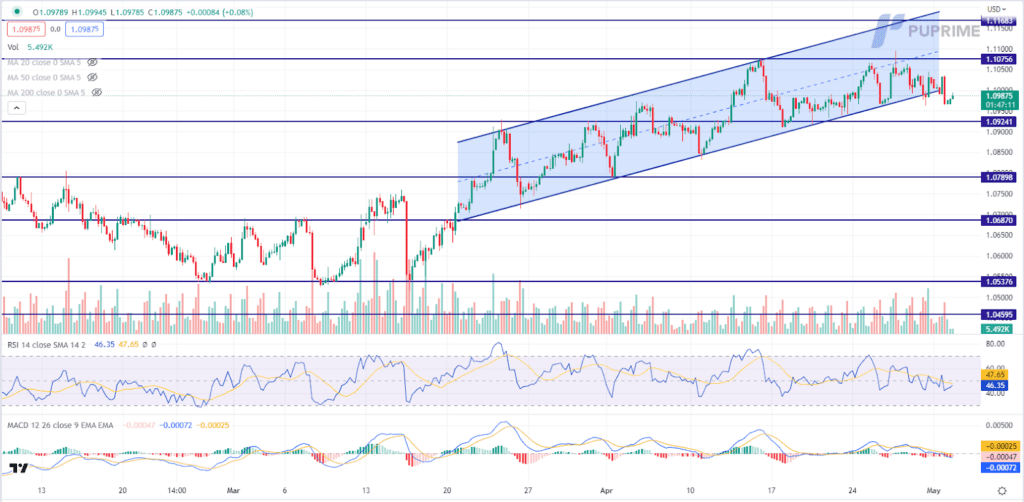
The Euro is trading sideways while currently near the support level. MACD has illustrated increasing bearish momentum, while RSI is at 46, suggesting the pair might trade lower as technical correction since the RSI stays below the midline.
Resistance level: 1.1075, 1.1168
Support level: 1.0924, 1.0790

The Japanese Yen has faced a sharp sell-off in the wake of the Bank of Japan’s decision to maintain its ultra-easing monetary policy, despite increasing pressure to adjust its policy. Kazuo Ueda, a key figure at the central bank, emphasised the need for longer-term easing policies to achieve sustained price stability, effectively reducing expectations for any policy adjustments soon.
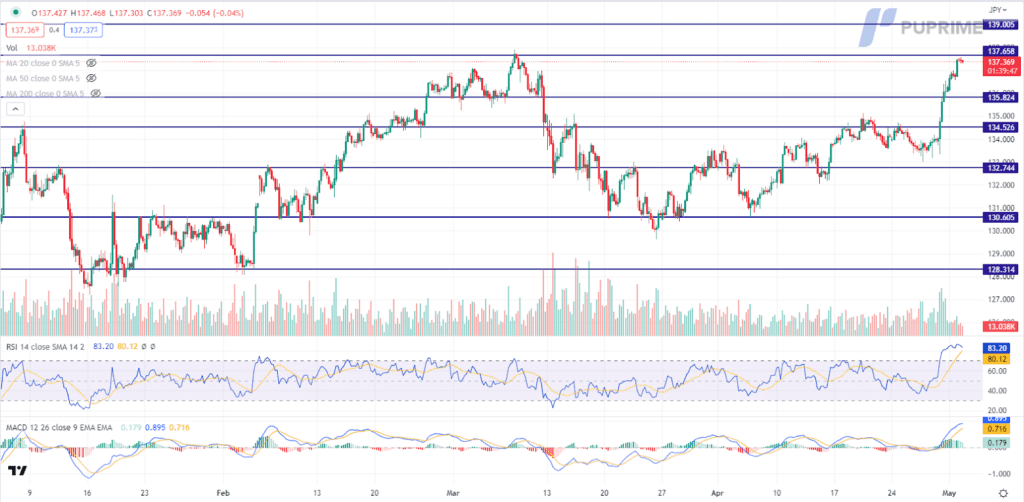
USDJPY is trading higher while currently testing the resistance level. However, MACD has illustrated diminishing bullish momentum, while RSI is at 83, suggesting the pair might enter overbought territory.
Resistance level: 137.65, 139.00
Support level: 135.82, 134.52

GBP/USD has seen a pullback primarily driven by the strengthening of the US Dollar, as there has been a lack of notable market catalysts from the UK region. The greenback’s surge was fueled by expectations of a 25-basis points interest rate hike by the Federal Reserve, alongside strong US manufacturing data, as indicated by the Institute for Supply Management’s PMI.
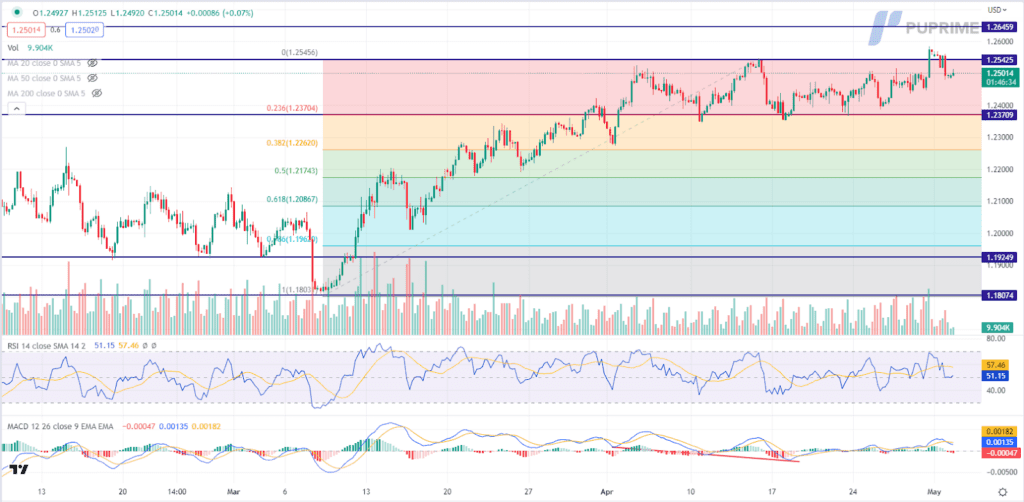
GBPUSD is trading lower following the prior retracement from the resistance level. MACD has illustrated increasing bearish momentum, while RSI is at 51, suggesting the pair might extend its losses since the RSI retreated sharply from overbought territory.
Resistance level: 1.2545, 1.2645
Support level: 1.2370, 1.2260

The Dow Jones Industrial Average was seen grappling with a lack of clear direction as mixed market sentiments persisted. In a recent turn of events, First Republic Bank has once again taken center stage, raising concerns over the mounting strains in the US regional banking sector. The bank’s ongoing woes have reignited fears that a looming credit crunch may be in the offing, thereby complicating matters for the upcoming policy meeting of the Federal Reserve. Against this backdrop, the risk appetite in the market remained tepid, with investors keeping a watchful eye on further monetary policy decisions from the Fed to gain insights into the probable trajectory of the US equity market.
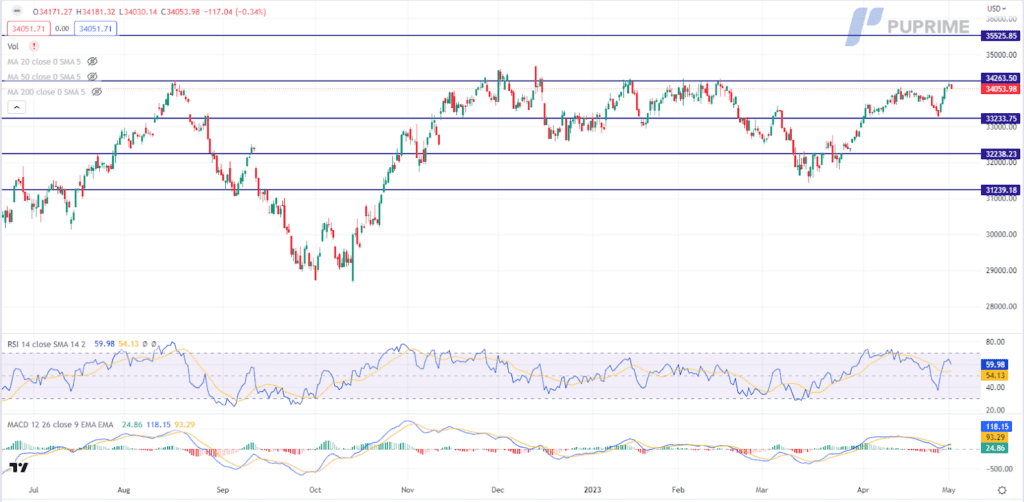
The Dow is trading flat while currently testing the resistance level. However, MACD has illustrated increasing bullish momentum, while RSI is at 60, suggesting the index might extend its gains after breakout since the RSI stays above the midline.
Resistance level: 34265.00, 35525.00
Support level: 33235.00, 32240.00

Oil prices have experienced a decline, as investors respond to weak economic data from China and anticipation of another interest rate hike by the U.S. Federal Reserve. China’s manufacturing activity unexpectedly contracted in April, according to official data released on Sunday. This marks the first time the manufacturing purchasing managers’ index has fallen since December and has contributed to a sense of uncertainty among investors. In addition, the U.S. Federal Reserve is widely expected to increase interest rates by another 25 basis points when it meets on May 2-3. This, coupled with a rising U.S. dollar, has made oil more expensive for holders of other currencies.
Oil prices are trading lower following the prior retracement from the resistance level. MACD has illustrated diminishing bullish momentum, while RSI is at 47, suggesting the commodity might extend its losses toward support level.
Resistance level: 76.30, 79.00
Support level: 74.10, 71.90

Trade forex, indices, cryptocurrencies, and more at industry-low spreads and lightning-fast execution.

8 August 2023, 06:21 U.S. Equity Market Closes Higher Ahead of CPI

7 August 2023, 06:10 Dollar Softer After NFP Comes Short

4 August 2023, 06:20 BoE Delivers 25 BPS Rate Hikes Softening Pound Sterling

Nouvelles inscriptions indisponibles
Nous n'acceptons pas de nouvelles inscriptions pour le moment.
Bien que les nouvelles inscriptions ne soient pas disponibles, les utilisateurs existants peuvent continuer leurs défis et activités de trading comme d'habitude.